Know how your brand sounds without visiting every store
When a brand has several locations, the question is always the same: is the music playing the way it should at each one? Until recently, answering it meant making calls, asking for photos or waiting for an end-of-month report. With the new Beatscape dashboard Home, the answer is on the first screen you see.
What you see when you sign in
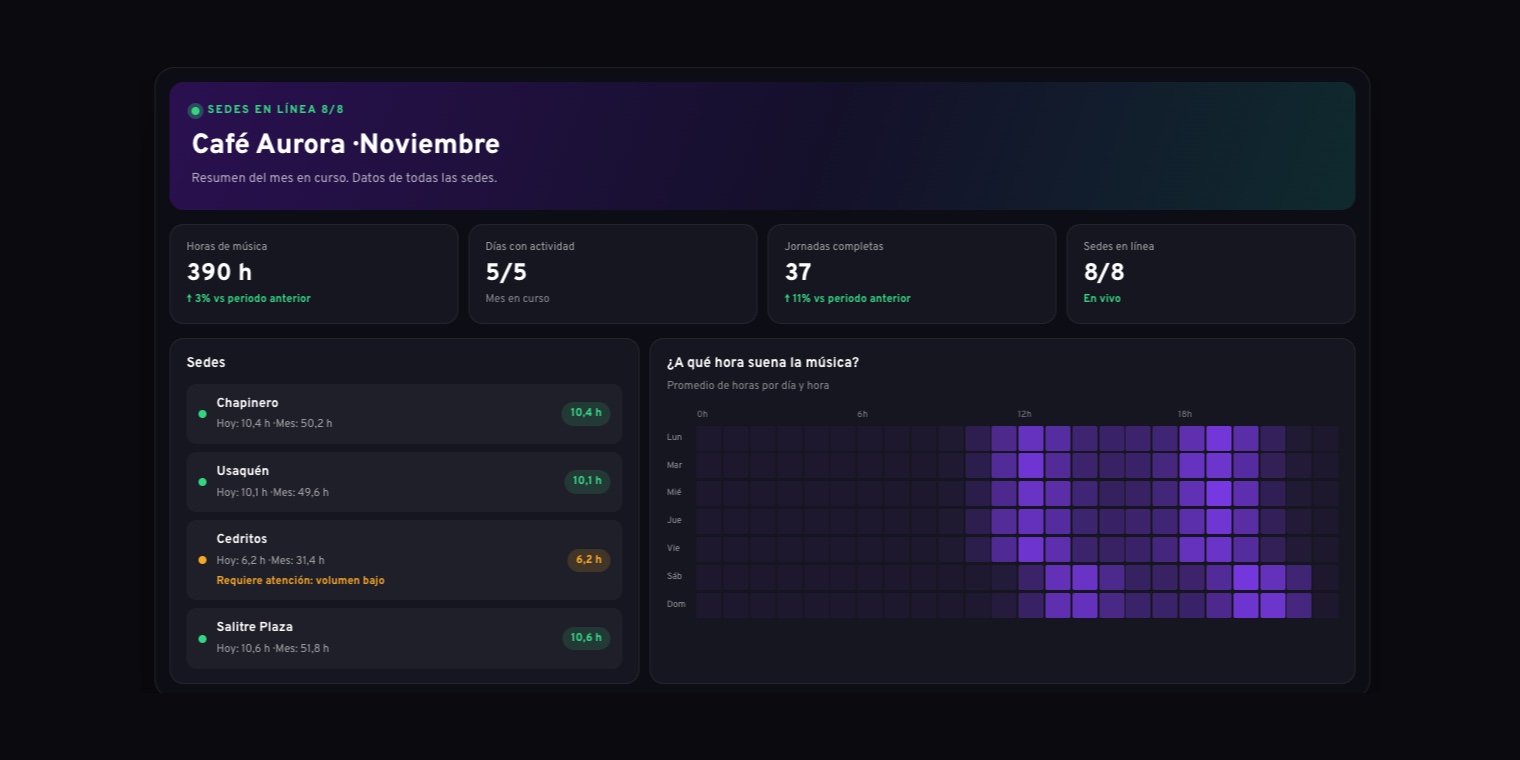
At the top you see the status of your network: how many locations are online (for example, 8 of 8) and the summary of the current month. Below it, four key indicators:
- Hours of music: the total played across all your locations this month.
- Active days: how many days of the month had music playing.
- Full shifts: how many times a location played music throughout its whole opening hours.
- Locations online: how many stores are connected right now.
Hours and full shifts are compared with the previous period, so you see right away whether usage is rising or falling, with no math.
The hours map: what time does the music play?
This is the most useful block for making decisions. It is a heat map with the seven days of the week and the 24 hours of the day: the more intense the color, the more music played at that moment.
You will usually see two peaks, one around noon and another in the early evening, with weekends shifting later. Use it to:
- Confirm every time slot is covered. A gap in the middle of opening hours is a signal to check.
- Schedule time slots with data. If your busiest time is between 6 and 8 pm, that slot deserves the most carefully curated music.
- Fine-tune weekends. If your audience arrives later, the map shows it and the schedule moves with it.
Usage trend
The usage trend chart compares the current month with the previous one, day by day: a solid line for the current month and a dashed one for the previous. It helps you spot a slow week, a change after a renovation or the effect of a high season at a glance.
Locations that need attention
The Locations panel lists each store with its hours for today and for the month. When something is wrong, the location is marked in amber with the reason. The most common cases:
- Disconnected: the store's computer lost its connection or is turned off.
- Outdated app: the location runs an older version of the player and should be updated.
- No activity: the store has not played music during its expected hours.
- Low volume: someone turned the computer's volume below the recommended level.
If a store stops playing, you know instantly, not when a customer mentions it.
Access for each client's IT team
Each company can give access to its technology team. Every user only sees their own company: its locations, its figures and nothing else. IT can check equipment, versions and connectivity without depending on anyone, and other brands' information is never visible.
A dashboard backed by people
The dashboard shows what is happening, but it does not work alone. Behind your account is the Beatscape human curation team, who design the music for each time slot and adjust it when the data calls for it. If the hours map shows your afternoon changed pace, or a location needs attention, you are not left with a chart: you have a team that solves it with you.
That is the difference between a reporting tool and a fully managed service: you see the summary, and we make sure the music is where and how it should be.
Get a quote
Do you have several locations and want to see them all on one screen? Get a quote on WhatsApp and we will review your case together. You can also see more updates at beatscape.co/novedades.